Markets.com Logo
euEnglish
LoginSign Up

Morning Note: US-China Tensions Renew; ISM PMI Eyed; S&P 500, EURUSD Outlook

Jun 2, 2025
4 min read
Table of Contents
  • 1. US & China are back at each other again on renewed accusations
  • 2. S&P 500 technical outlook
  • 3. EURUSD technical outlook

US-China-Tensions-1200-format-webp.jpg

US & China are back at each other again on renewed accusations

After last week’s legal tariff roller coaster rise, when a federal appeals court granted a temporary reprieve to President Trump's broad tariffs, permitting them to remain in effect—just one day after the U.S. Court of International Trade had halted their implementation, ruling that the administration's method of imposing them was 'unlawful.

Asian stocks mostly declined on Monday following President Trump's announcement that tariffs on steel and aluminium imports would double to 50%, effective June 4. The move drew sharp criticism from China, which rejected Trump's accusation that Beijing had violated the agreement reached in Geneva last month, further reducing the likelihood of near-term talks between the two leaders. Meanwhile, the dollar weakened, while gold prices edged higher amid the rising trade tensions.

S&P 500 technical outlook

From around mid-May, the S&P 500 cash index started moving sideways, trading roughly between the 5786 and 5973 levels. Given that the prevailing trend was to the upside, the short-term technical outlook points more towards the upside. That said, until we get a confirmation break, we will remain neutral.

A push above the 5973 territory may attract a few buyers into the game, confirming a continuation of the current short-term uptrend, which has been in play since the beginning of April. We will then target the current all-time high area, near the 6147 zone.

Alternatively, a break below the 5786 hurdle could spook the bulls from the field for a bit. At the same time, we could be testing the 50-, 100- and 200-day EMAs on our daily chart, which if fail to provide support, may signal further declines. That’s when we will aim for the 5700 area, or even the 5578 zone, marked near the lowest point of May.

Picture 1, Picture

Traders and investors are monitoring the US ISM manufacturing PMI Today

The U.S. ISM Manufacturing PMI edged down to 48.7 in April 2025 from 49.0 in March, remaining slightly above market forecasts of 48 but marking the second straight month of sector contraction. The decline reflected sharper output reductions and accelerating price pressures. While new orders contracted at a more moderate pace, export orders weakened further due to tariff disruptions. Employment conditions showed modest improvement, with job losses easing.

Survey respondents highlighted growing operational challenges, including mounting input costs squeezing margins and trade policy uncertainty disrupting supply chains through shipping delays, complex tariff duties, and volatile cost structures. Manufacturers also reported increasingly erratic demand patterns, with some customers postponing orders or attempting to pass tariff expenses upstream.

Today, at 14:00 GMT, the economic indicator is expected to improve slightly, going from 48.7 to 49.5. If the number comes out close to the forecast, but still below 50, this will mark the third month in a row of the sectors remaining in contraction territory.  

Picture 1, Picture

EURUSD technical outlook

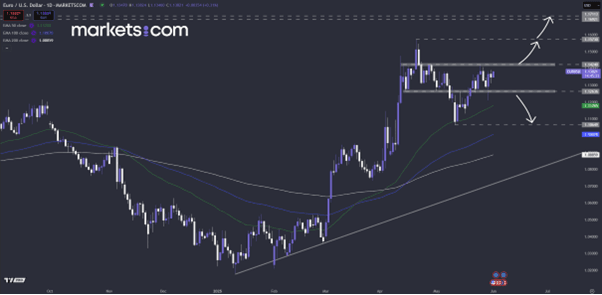
After a brief correction lower during the first half of May, EURUSD reversed course again and started pointing to the upside. However, it is currently struggling to overcome the 1.1424 zone, which has been a strong resistance area since the end of April. We will remain cautiously bullish and wait for a confirmation break above that resistance zone first, before getting more comfortable with higher areas. Another weak ISM reading could apply negative pressure on the US dollar.

A push above the 1.1424 barrier may invite more buyers, possibly clearing the path towards the current highest point of this year, near the 1.1573 hurdle. However, if the bulls remain unstoppable, the pair might travel towards the 1.1700 area for its next pit stop.

We will shift our attention towards lower areas on a rate drop below the 1.1263 territory and the 50-day EMA, shown as the green line. That’s when we will target the 1.1065 hurdle, marked by the lowest point of May. By that time, the 100-day EMA, shown as the blue line, could act as an additional area of support.

Picture 1, Picture


When considering shares, indices, forex (foreign exchange) and commodities for trading and price predictions, remember that trading CFDs involves a significant degree of risk and could result in capital loss.  

Past performance is not indicative of any future results. This information is provided for informative purposes only and should not be construed to be investment advice.  


Risk Warning and Disclaimer: This article represents only the author’s views and is for reference only. It does not constitute investment advice or financial guidance, nor does it represent the stance of the Markets.com platform. Trading Contracts for Difference (CFDs) involves high leverage and significant risks. Before making any trading decisions, we recommend consulting a professional financial advisor to assess your financial situation and risk tolerance. Any trading decisions based on this article are at your own risk.

Darius Anucauskas
Written by
Darius Anucauskas
SHARE

Markets

  • Palladium - Cash

    chartpng

    --

    -0.71%
  • EUR/USD

    chartpng

    --

    0.04%
  • Cotton

    chartpng

    --

    -0.28%
  • AUD/USD

    chartpng

    --

    -0.42%
  • Santander

    chartpng

    --

    -1.43%
  • Apple.svg

    Apple

    chartpng

    --

    0.51%
  • easyJet

    chartpng

    --

    -1.59%
  • VIXX

    chartpng

    --

    1.80%
  • Silver

    chartpng

    --

    0.39%
Tags DirectoryView all
Table of Contents
  • 1. US & China are back at each other again on renewed accusations
  • 2. S&P 500 technical outlook
  • 3. EURUSD technical outlook

Related Articles

Solana Price Gains 4%: What is the price target for Solana?

Solana Price Gains 4%: Solana, a prominent blockchain platform known for its high-speed transactions and low fees, recently saw a notable increase in its price by approximately 4%.

Ghko B|1 day ago

Bitcoin Price Outlook: What will be the value of Bitcoin in 2025?

Bitcoin Price Outlook: Bitcoin has long been a subject of intense discussion and speculation, captivating attention across the world.

Frances Wang|1 day ago

Morning Note: Markets Break Records - What’s Fueling the Surge?

Global stocks climbed to record highs for the second consecutive session on Thursday, while the U.S. dollar strengthened following a stronger-than-expected jobs report.

Tommy Yap|1 day ago
Markets.com Logo
google playapp storeweb tradertradingView

Contact Us

support@markets.com+12845680155

Markets

  • Forex
  • Shares
  • Commodities
  • Indices
  • Crypto
  • ETFs
  • Bonds

Trading

  • Trading Tools
  • Platform
  • Web Platform
  • App
  • TradingView
  • MT4
  • MT5
  • CFD Trading
  • CFD Asset List
  • Trading Info
  • Trading Conditions
  • Trading Hours
  • Trading Calculators
  • Economic Calendar

Learn

  • News
  • Trading Basics
  • Glossary
  • Webinars
  • Traders' Clinic
  • Education Centre

About

  • Why markets.com
  • Global Offering
  • Our Group
  • Careers
  • FAQs
  • Legal Pack
  • Safety Online
  • Complaints
  • Contact Support
  • Help Centre
  • Sitemap
  • Cookie Disclosure
  • Regulation
  • Awards and Media

Promo

  • Gold Festival
  • Crypto Trading
  • marketsClub
  • Welcome Bonus
  • Loyal Bonus
  • Referral Bonus

Partnership

  • Affiliation
  • IB

Follow us on

  • Facebook
  • Instagram
  • Twitter
  • Youtube
  • Linkedin
  • Threads
  • Tiktok

Listed on

  • 2023 Best Trading Platform Middle East - International Business Magazine
  • 2023 Best Trading Conditions Broker - Forexing.com
  • 2023 Most Trusted Forex Broker - Forexing.com
  • 2023 Most Transparent Broker - AllForexBonus.com
  • 2024 Best Broker for Beginners, United Kingdom - Global Brands Magazine
  • 2024 Best MT4 & MT5 Trading Platform Europe - Brands Review Magazine
  • 2024 Top Research and Education Resources Asia - Global Business and Finance Magazine
  • 2024 Leading CFD Broker Africa - Brands Review Magazine
  • 2024 Best Broker For Beginners LATAM - Global Business and Finance Magazine
  • 2024 Best Mobile Trading App MENA - Brands Review Magazine
  • 2024 Best Outstanding Value Brokerage MENA - Global Business and Finance Magazine
  • 2024 Best Broker for Customer Service MENA - Global Business and Finance Magazine
LegalLegal PackCookie DisclosureSafety Online

Payment
Methods

mastercardvisanetellerskrillwire transferzotapay
The markets.com/za/ site is operated by Markets South Africa (Pty) Ltd which is a regulated by the FSCA under license no. 46860 and licensed to operate as an Over The Counter Derivatives Provider (ODP) in terms of the Financial Markets Act no.19 of 2012. Markets South Africa (Pty) Ltd is located at BOUNDARY PLACE 18 RIVONIA ROAD, ILLOVO SANDTON, JOHANNESBURG, GAUTENG, 2196, South Africa. 

High Risk Investment Warning: Trading Foreign Exchange (Forex) and Contracts For Difference (CFDs) is highly speculative, carries a high level of risk and is not appropriate for every investor. You may sustain a loss of some or all of your invested capital, therefore, you should not speculate with capital that you cannot afford to lose. You should be aware of all the risks associated with trading on margin. Please read the full  Risk Disclosure Statement which gives you a more detailed explanation of the risks involved.

For privacy and data protection related complaints please contact us at privacy@markets.com. Please read our PRIVACY POLICY STATEMENT for more information on handling of personal data.

Markets.com operates through the following subsidiaries:

Safecap Investments Limited, which is regulated by the Cyprus Securities and Exchange Commission (“CySEC”) under license no. 092/08. Safecap is incorporated in the Republic of Cyprus under company number ΗΕ186196.

Finalto International Limited is registered  in the Saint Vincent and The Grenadines (“SVG”) under the revised Laws of Saint Vincent and The Grenadines 2009, with registration number  27030 BC 2023.

Close
Close

set cookie

set cookie

We use cookies to do things like offer live chat support and show you content we think you’ll be interested in. If you’re happy with the use of cookies by markets.com, click accept.